 The Bio-Analytic Resource: Instructions
Welcome to the Bio-Analytic Resource at the University of Toronto. The BAR is maintained by Dr. Nicholas Provart and his lab. The BAR is funded in part by Centre for the Analysis of Genome Evolution and Function, grants from the Canada Foundation for Innovation to Dr. Provart, and from Genome Canada to the Arabidopsis Research Group at the Department of Cell and Systems Biology, University of Toronto. The BAR may be used to explore large-scale data sets from Arabidopsis and other species, and for hypothesis generation. Questions that can be answered are, for example, are there any genes that are co-expressed with my gene of interest? Are there any predicted interactors with my favourite protein? Where is my gene expressed? Use Expression Angler, the Arabidopsis Interactions Viewer, and the eFP Browser, respectively, to answer such questions!
Project Browser
The Project Browser may be used to download entire data sets from the Bio-Analytic Resource Database, insofar as they have been released to the public, which happens after publication, or after 6 months, whichever comes first. The various tabs 'General Information', 'BioSource Information', 'Extraction/Labelling Information', 'Slide Information', 'Hybridization', and 'Scanning Protocol/Analysis Information' contain the MIAME-compliant details as to how a particular sample was treated, grown, extracted, hybridized and processed. The 'Get the Data' hyperlink will allow you to download the entire data set for that project to your computer, including MAS5.0 'present', 'marginal', and 'absent' calls for each expression measurement.
Expression Browser
The Expression Browser is a tool for performing electronic Northerns. It has significant advantages over other online tools. For instance, it is possible to query with more than 400 genes at once, making the exploration of large gene families tractable. Second, we permit the automatic calculation of response ratios, that is, the ratio of a given treatment signal to the corresponding control signal. Third, 15 dimensions of information, such as GO functional classification, annotations, gene aliases, as well as experiment meta-information (age of plant, length of treatment etc.) are appended to the output.
Expression Browser - Database
The Expression Browser allows you to query different expression databases. Currently you can search in the Bio-Analytic Resource Database, which contains expression levels from the Affymetrix ATH1 Whole Genome GeneChip for ca. 22810 genes across approximately 175 samples in Arabidopsis. Alternately, you may search in several data sets from AtGenExpress Consortium, which is coordinated by Lutz Nover (Frankfurt), Thomas Altmann (Potsdam) and Detlef Weigel (Tübingen), and supported by funds from the DFG and the Max Planck Society, and from other individual researchers. The AtGenExpress developmental data set was produced by Markus Schmid and Jan Lohmann (MPI Tübingen) and is published in Schmid et al. 2005, Nature Genet. 37: 501-6. The other AtGenExpress data sets are best documented at TAIR. Click the links to go to documentation for Kilian et al.'s Abiotic Stress, Biotic Stress, and Hormone data sets. In our tools we link out to these data sets as archived at NASCArrays, however. We have also added several cell-type-specific data sets from various sources, which are linked from the output page of the Expression Browser via their GEO records or via the corresponding publications.
Expression Browser - Filters
In the case of the Affymetrix data generated in-house, we assign projects, which are collections of samples, to the different research areas. The research areas listed are mainly for internal tracking purposes, but most experiments conducted in the BAR fall into the Environmental and Stress Physiology, Plant Physiology, and Plant-Microbe and Plant-Insect Interactions categories. The tissue type of a given sample is also tracked, as is the growth stage of the plant according to Boyes growth stages (see Boyes et al., 2001. Plant Cell 13:1499-510, or the table at TAIR).
Expression Browser - Output Options
• The 'Raw' option returns expression values across all samples that pass the selected filters. No averaging of replicate samples is performed, nor is the ratio of treatment to control calculated. Note that these expression values are from normalized GeneChip data. In the case of the Bio-Analytic Resource data, we use a TGT value of 500, while the AtGenExpress Tissue series data set is normalized using RMA, and as such the values from the two sets are not directly comparable. The AtGenExpress data sets for the "plus", abiotic stress, biotic stress and for hormone treatments are all normalized to a TGT value of 100.
• The 'Average of Replicate Treatments' option will automatically calculate the average expression levels for biological replicates, if they have been performed.
• The third 'Average of replicate treatments relative to average of appropriate control' option will calculate the average for replicate treatments and divide this by the average of the appropriate controls, as specified by the investigator upon project submission or by our curators.
In the case of the AtGenExpress tissue data set and the seed data set, for a given gene we have calculated the median value across essentially all wild-type samples in the Schmid et al., 2005, Nature Genet. 37: 501-6 data set or in the seed data set (compiled from many sources), and the actual samples we used for this calculation may be found in this file or in this file. We use this as the control value for that gene. For the other AtGenExpress data sets, we have stored the controls as separate projects, so linkouts to NASCArrays will just take you to this notice. Click on the Treatment samples to see the appropriate controls for a given experiment at NASCArrays.
• If you want to cluster the results according to the similarity between samples, check the 'Cluster horizontally' box. Genes will automatically be clustered by the similarity of their expression profiles - or they may be viewed without clustering: see the Expression Browser - Output section below.
Expression Browser - AGI IDs and My Protein Categories
Simply paste a list of AGI IDs into this box. An AGI ID has a format that looks like At3g27340. You can paste in up to 125 identifiers, each separated by a new-line (return) character. If you copy a column of identifiers from Excel and paste it in, the new-line character is present. Note that the AGI number must map to a probe set identifier on the ATH1 GeneChip for you to be able to get expression values. You will be notified if this is not possible.
My Protein Categories: if you are dealing with multiple genes, you may have your own codes or descriptions for your AGI identifiers. You can paste these identifiers (in the same order as the corresponding AGI IDs) into this box. Also, you can append a colour to this category with an underscore and the colour in hexadecimal format. So in the following example, you would paste the AGI numbers into the first box, and either the descriptors in the second or third column into the 2nd box. If you don't specify a colour, then no colouration will be applied. The categories and colours are useful for visualization purposes in the output of the Expression Browser, and will appear in the thumbnail representation. If you don't enter anything in the My Protein Categories box, then gene aliases (e.g. ABI3) will appear in the thumbnail, if present.
At5g40140	ARM	ARM_#00CC66
At3g19380	ARM	ARM_#00CC66
At4g00340	SD2	SD2_#FF9966
At1g49780	ARM	ARM_#00CC66
At1g11300	SD1	SD1_#FFFF99
At3g18710	ARM	ARM_#00CC66
Expression Browser - Output
Once the results are returned, you may view them in several different formats.
View Data in Raw Text Format. The data selected from the database are returned in plain-text format. Columns are separated by tab characters. If you right-click and 'Save as...' somewhere on your computer, you can then open this file with Excel or most other programs, such as Cluster and TreeView from Michael Eisen's laboratory, for further manipulation.
View Graphical Representation of Unclustered Data. Clicking on this link will activate a program, called the Data Metaformatter, that will append various pieces of information from TAIR and GO, and generate a thumbnail overview of the expression data. The data have not been clustered, and the order of samples is somewhat random, while the genes remain in the order in which you entered them.
View Graphical Representation of Clustered Data. Clicking on this link will activate a program, called the Data Metaformatter, that will append various pieces of information from TAIR and GO, and generate a thumbnail overview of the expression data. The data have been clustered hierarchically using an centered correlation similarity metric (Pearson's correlation coefficient) and average linkage clustering.
View Graphical Representation of Log Transformed Clustered Data. This output style is only available if you've opted to look at the ratio values for treatment versus control. Clicking on this link will activate a program, called the Data Metaformatter, that will append various pieces of information from TAIR and GO, and generate a thumbnail overview of the expression data. The data have been clustered hierarchically using a centered correlation similarity metric (Pearson's correlation coefficient) and average linkage clustering. The data are also log base 2 transformed so that ratios between 0 and 1 are not compressed in number space. To get the actual ratio values, the values in the HTML table of the Data Metaformatter are used as the exponent for 2, so a value in the table of, say, -2, would equal a ratio of 0.25 (2 to the exponent -2), which is 4-fold down relative to the control. You can also look at the non-log transformed results to get the fold-change values.
Data MetaFormatter
This program appends information to a data table, in plain-text tab-delimited format, to make interpretation of the data set easier. The top part of the display contains a list of the samples, and if the information on the #age, #tissue, #category, #mutant, #timecourse, and/or #control is included in the top rows of the table, then this information will be displayed along with the list of samples.
In addition, this information, along with information about a given gene's GO functional classification, and 'My Gene Category', if present, is displayed in thumbnail format, along with a colour-coded 'heat map' corresponding to the expression levels. If cluster information is present, this is also displayed as a tree diagram beside - indicating how similar expression patterns for different genes are -, or below - indicating how similar samples are for the list of genes - the thumbnail. As of February 2006 it is possible to mouse-over the AGI number in the thumbnail and see its annotation in the info bar at the top of the page, and if you click on the AGI number you will see an 'electronic Fluorescent Pictograph' representation of that gene's expression based on the Schmid et al., 2005, Nature Genet. 37: 501-6 Arabidopsis Gene Expression Atlas. The following is a guide to the thumbnail.
The HTML table at the bottom of the page contains the actual expression levels, #age, #tissue, #category, #mutant, #timecourse, and #control information, and full annotations and gene names (if available) from TAIR, using the appropriate lookup table from TAIR (the version that is used to do this is available on the BAR homepage). The AGI numbers are linked to the corresponding record at TAIR. Mousing over the classification barcode will tell you what sub-category that gene falls into.
The Data MetaFormatter can also be used on its own for your own data, as long as you use plain-text format, and tab-delimiters, and the columns are ID, Annotation,value1,value2,value3...the first row should contain the column titles.
Expression Angler
Expression Angler will identify genes that exhibit co-expression, in the data sets/compendia we have compiled for such analyses. The data sets used by this tool come from the Bio-Analytic Resource, NASCArrays, the AtGenExpress Consortium's Tissue, Abiotic Stress, Pathogen or Hormone compendia, and other compendia compiled by the BAR curators. The AtGenExpress developmental data set was produced by Markus Schmid and Jan Lohmann (MPI Tübingen) and is published in Schmid et al., 2005, Nature Genet. 37: 501-6. The other AtGenExpress data sets are best documented at TAIR. Click the links to go to documentation for Abiotic Stress, Biotic Stress and Hormone data sets. The expression compendium from the BAR consist of 93 samples, with plant age, experiment type, tissue type, and treatment information appended. The AtGenExpress Developmental compendium consists of expression level measurements from 79 tissues samples in triplicate, again with meta-information appended. The data from NASCArrays are from 392 samples. [Thanks to David Craigon at NASCArrays for making this data set available in a file, called supercluster.txt, that was downloaded on the 23rd of February, 2004.] Other compendia that we have compiled include the AtGenExpress Plus - Extended Tissue Compendium encompassing the AtGenExpress Developmental Map and cell-type-specific samples as denoted in our eFP views here and here, a Root Compendium as denoted in this eFP view, a Seed Compendium as per this eFP view, and finally a Natural Variation Compendium as in this eFP view. The actual GEO or NASCArrays or other identifiers for each sample are available on the output pages, in the headers of the results file. Note that because the number of columns in several of these data sets is >255, older versions Excel will not be able to load the downloaded files completely - but you will still be able to see the IDs and r-values, which are prefixed to a given gene's annotation. Note too that because of the different samples in each data set, the r-value results returned may not be the same when you do the analyses with a given gen in different compendia - but this is also informative, especially if you are searching for secondary roles for your gene of interest: leave out the tissue types where it is known to play a major role (see Usadel et al. 2009 for a discussion of this phenomenon). The AGI ID to probe set conversion is based on a file from TAIR, indicated on the BAR homepage.
The metric for measuring similarity of expression patterns is the Pearson correlation coefficient, commonly denoted by r. It is calculated for two gene expression vectors (series of values over a given number of samples) as follows:
Note that the Pearson correlation coefficient effectively normalizes the magnitude of the expression vector. Thus the Expression Angler program will identify those genes which respond in a similar manner. That is, genes which have a relatively moderate expression pattern in, say, Sample 1 and a high relative expression level in Sample 2, and a low relative expression level in Sample 3, and so on, will be identified as similar (will be scored with a higher r-value), even if the expression levels are dramatically different. For the two expression vectors for Genes X and Y above, the Pearson correlation coefficient is one, that is, the genes are responding identically! You may wish to manually examine the absolute expression levels on the output, especially if you are planning to use the genes as markers - you would want relatively strong expressors in this case.
All genes having a correlation coefficient higher than the specified threshold will be returned, with the stipulation that a given gene must map to a probe set on the GeneChip. As a rule of thumb, anything below 0.7 is not very well co-expressed, but may be significant. See Usadel et al. 2009 for a discussion of how to convert r-values to p-values.
If you are interested in genes that are anti-correlated with your gene of interest, choose the bottom 25, 50 or 100 genes to view. The genes have the most opposite expression pattern to your gene of interest are at the very top of the list that is returned, which is sorted by increasing r-value. Again, the r-value is prefixed to the gene's annotation in the Expression Angler output.
Expression Angler - Subselect and Custom Bait
You may also remove samples for the correlation calculation, on the subselect page. If, for instance, you know that a gene is up-regulated in seeds, but are interested as to whether it exhibits co-expression with genes in other tissues, you may wish to drop the seed samples for the calculation, as otherwise you will identify large numbers of genes that are seed-specific. You may also design your own custom bait. This is very useful for identifying genes which are
• expressed only in certain tissues
• expressed only under certain conditions
• expressed only in a mutant but not wild-type.
You can then use these genes as condition-specific markers or to identify their promoters to drive condition-specific expression of a transgene. For example, if you want to identify a set of genes that are increaing under cold stress in roots, but not in leaves or under any other stress select all the samples using the 'select all' checkbox, and then enter, say, 2 in the the 0.5 h Root Cold Stress boxes, 4 in the 1 h boxes and so on, like this:
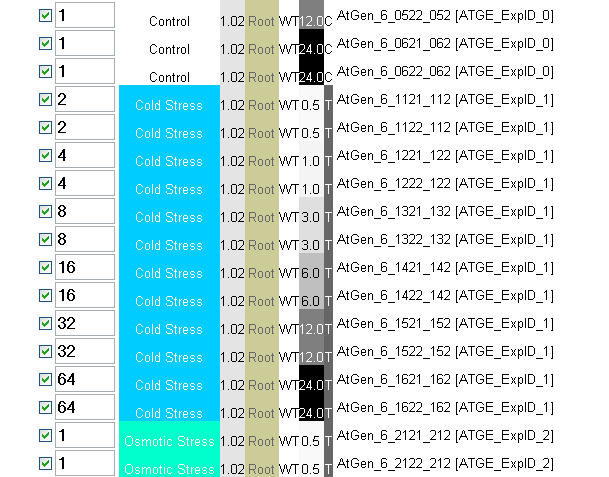
Then make sure the 'Check to enter custom bait' box is checked, and click submit. Because the calculation for the Pearson correlation coefficient mean-centers and standardizes each profile by the standard deviation, the absolute value that you enter is not important. It is, rather, the shape of the profile that is important. Because you don't know if the profile you are entering is realistic, it is probably better to select the 'Return top 25, 50 or 100 Hits' option, as opposed to specifying an exact r-value cutoff. You will then see if it is or is not realistic based on the profiles of the genes you identify, regardless of their r-value...you'd be looking for strong expression signals in the samples for which you designed the custom bait to identify genes for.
Expression Angler - Upload
You can also upload your own data set, in plain-text format, as long as you follow the convention of the sample data set available in the link next to the upload box. Note that with this sample data set, because of its limited size, only a few AGIs will work. For instance, At2g32830 corresponds to the first GeneChip identifier in the sample file, so if you are trying the upload feature, enter At2g32830 into the AGI box, and set the r-value cutoff to 0.2 or select the top 25 option (this is not a real data set!). Note that the identifiers in the file you upload must be ATH1 Whole Genome GeneChip identifiers. Use the _at to AGI Converter on the BAR Homepage at http://www.bar.utoronto.ca to see if a probe set for your AGI number is on the GeneChip. As an aside, you may also enter a ATH1 probe set identifier instead of an AGI number.
On the output page you will be given the option to view the output as plain-text, or formatted with the Data Metaformatter. The latter will generate an overview thumbnail, along with an HTML table appended with various pieces of information from TAIR and GO. The Pearson r-value is prepended to the annotation. Co-expressed genes may share cis-elements, and you can use the 'Analyze with Promomer' hyperlink to send the list of co-expressed AGI IDs to Promomer.
Expression Angler - Output
Once the results are returned, you may view them in three different ways, or activate the Promomer program in a new window, as long as less than one hundred genes are returned. If the number of genes returned is greater than 100, go back to the start page and increase your r-value cutoff to the level specified on the output page if you want to view the graphical summaries or activate the Promomer program. Large numbers of genes tend to be returned for genes expressed at low levels, although those with the highest r-values to your gene of interest could still be biologically significant.
View data set as text. The data selected from the database are returned in plain-text format. Columns are separated by tab characters. If you right-click and 'Save as...' somewhere on your computer, you can then open this file with Excel for further manipulation. Note that if you have angled in the NASCArrays data set, Excel will truncate the samples at 255. You will still be able to see the gene annotations and r-values, however.
View formatted data set. Clicking on this link will activate a program, called the Data Metaformatter, that will append various pieces of information from TAIR and GO, and generate a thumbnail overview of the expression data. The genes identified are ordered by descending r-value relative to the gene you angled with.
View formatted data set after median centering and normalization. Clicking on this link will activate a program, called the Data Metaformatter, that will append various pieces of information from TAIR and GO, and generate a thumbnail overview of the expression data. Median centering subtracts from all vector values the median value of the vector, and normalization then scales the vector such that the sum of squares is equal to 1. This allows a better appreciation of the the conditions under which other genes are responding in the same way to your gene of interest.
Activate the Promomer Program using the AGIs identified. Clicking on this link will activate the Promomer program to identify potential cis-elements in the promoters of the co-expressed genes identified by the Expression Angler. See the following section describing Promomer.
Sample Angler
The Sample Angler will identify samples that exhibit similar fingerprints of expression of all genes or of a subset of genes, in the Bio-Analytic Resource database, in several AtGenExpress data sets from the AtGenExpress Consortium and an in-house generated chemical genomics data set.
We were inspired to build this tool based on a study by Marton et al. (1998) in which the authors were able to show similar gene expression response profiles for certain drug treatments.
You can use all 22814 genes (probe sets) on the ATH1 Affymetrix microarray but it is probably wise to discard the cases where e.g. the MAS5.0 call is "absent". All genes (probe sets) are included in our data sets. It is up to you to compare only the ones that are relevant as per the above. We use MAS5.0 normalization with at TGT value of 100. Ratios were calculated using these data. Marton et al. used ratiometric comparisons in their study. That said, the Pearson correlation coefficient effectively mean centers and normalizes the data allowing one to look across chips without calculating ratios.
Promomer
Promomer is a word-counting program for promoter analyses. It uses promoter data sets from TAIR, as indicated on its input page. It has four main sub-programs.
• Identify a statistically over-represented element in your gene of interest. Enter the AGI number, and the number of base pairs in the element, and the minimum number of occurrences of that element in your gene. Promomer will count all the 'words' of the specified length that are present in the promoter of that gene, and compare their frequency to a background data set of all the promoters in the genome, to see if that element is over-represented.
• Identify a statistically over-represented element in a group of genes. Similar in idea to the first program, except that you are inputting a list of genes. This is the program that is coupled with the Expression Angler.
• Identify genes in the genome that contain my element of interest. This is a search tool to identify other genes in the genome that have the element specified by you in their promoters. A SeqLogo of the consensus sequence is displayed.
• Identify your element of interest in a group of genes. Basically the same functionality as the 3rd program, except you are limiting the search to a group of promoters. A background distribution and a SeqLogo are returned.
Cistome and Cistome Map
Cistome and Cistome Map are tools for predicting and mapping cis-elements in Arabidopsis. Cistome differs from Promomer in incorporating 3rd party prediction programs that permit wobbles at positions within a putative cis-element, as well as a new version of Promomer, Promomer2, that also permits wobbles. PSSMs (position-specific scoring matrices) as opposed to consensus sequences are returned, along with an evaluation of their significance, performed by Bootmer2. In addition, Cistome will display literature-documented cis-elements from PLACE.
• Cistome Background Datasets
Upstream sequences from TAIR (version as indicated on the Cistome website) may either start from the TSS or TrSS. Data sets include original upstream sequences, only sequences starting at the TSS and only sequences starting at the TrSS, keyed as follows:
Note: TSS = Transcription Start Site; TrSS = Translational Start Site
TAIR upstream sequences x start x bp upstream of TSS or TrSS.
TAIR TSS x sequences start x bp upstream of the TSS. Search is limited to promoters of genes with an annotated TSS.
TAIR TrSS x sequences start x bp upstream of the TrSS. Search is limited to "promoters" that end with a TrSS.
• Cistome Significance Parameters
The example AGI IDs are a subset of ABA upreguated genes and show the necessary format for the AGI IDs.
Ze cutoff Distance between two non-parametric bootstrap distributions - one sampled from the input gene set and the other sampled from the entire genome.
Proportion cutoff The percentage of genes that the motif must be found in before being considered significant.
Functional Depth (IC - ICmin) / (ICmax - ICmin)
Search both strands Search and report from both the forward and reverse strands for motifs if selected.
• Cistome PLACE Scan
Scan can be performed with the entire PLACE database or just the annotated Arabidopsis thaliana elements.
The desired promoter dataset is scanned with motifs catalogued in the PLACE database.
Raw PSSMs are scored for significant with Bootmer2.
Significant PSSMs are mapped back onto the promoter sequences.
• Cistome Cis-element Prediction
Search for cis-elements with one of the following 3rd party prediction programs.
- AlignACE
- Utilizes a Gibbs sampling strategy
- Hughes JD, Estep PW, Tavazoie S, and Church GM (2000). Computational identification of cis-regulatory elements associated with groups of functionally related genes in Saccharomyces cerevisiae. Journal of Molecular Biology 296(5):1205-14.
- BioProspector
- Liu X, Brutlag DL, Liu JS (2001). BioProspector: discovering conserved DNA motifs in upstream regulatory regions of co-expressed genes. Pac Symp Biocomput. 2001:127-38.
- MEME
- Expectation maximization
- Searches for repeated, ungapped sequence patterns that occur in the DNA or protein sequences
- Bailey TL and Elkan C (1994) Fitting a mixture model by expectation maximization to discover motifs in biopolymers, Proceedings of the Second International Conference on Intelligent Systems for Molecular Biology, pp. 28-36, AAAI Press, Menlo Park, California.
- Motif Sampler
- Thijs et al. (2001) A higher-order background model improves the detection of promoter regulatory elements by Gibbs sampling. Bioinformatics 17:1113-22.
- Weeder
- Word enumeration
- Pavesi G, Mereghetti P, Mauri G, Pesole G et al. (2004) Weeder Web: discovery of transcription factor binding sites in a set of sequences from co-regulated genes. Nucleic Acids Research 32: 199-203.
Note: Raw PSSMs are scored with Bootmer2 rather than the 3rd party programs themselves. Set Ze = 0 to obtain raw PSSMs from each program.
• Cistome PROMOMER2 Prediction
Promomer2 scans a given promoter data set for over-represented k-mers with mismatches. All raw PSSMs meeting the significance criteria are scored for significance with Bootmer2.
• Cistome Map
Cistome Map will draw representations of the selected promoter data sets, and will overlay boxes for PSSMs or consensus sequences that have been entered in the appropriate format.
Be sure to check the proper radio button of PSSM mapping before submitting the query.
To map consensus sequences, use a fasta-like format
> ABRE
RYACGTGT
> BZIP-core
ACGT
> RYREPEAT
CATGCA
To map PSSMs, use this modified fasta-like format, and the standard IUPAC DNA codes
> label
A values
C values
G values
T values
Each column represents the count of occurrences for A,C,G and T at that position in the cis-element. These values should be tab-delimited e.g.
> ABRELATERD1
22 0 0 0 0
0 22 0 0 0
0 0 22 0 22
0 0 0 22 0
> ABRERATCA
2 20 0 0 0 0 0
18 0 20 0 3 0 1
0 0 0 20 0 20 6
0 0 0 0 17 0 13
> ACGTATERD1
55 0 0 0
0 55 0 0
0 0 55 0
0 0 0 55
electronic Fluorescent Pictograph Browser
The eFP Browser tool
paints gene expression information from one of the AtGenExpress data
sets or other compendia for your desired gene onto a diagrammatic
representation of Arabidopsis thaliana or poplar plants. The first data set is wild-type tissues represented in the Schmid
et al., 2005, Nature Genet. 37: 501-6 Atlas of Arabidopsis Development. The
second set displays the time course of the Abiotic Stress Series from Kilian et
al. (2007, Plant J.). The remaining sets - Biotic Stress, Hormone, and Chemical - were produced by members of the AtGenExpress Consortium or were produced by various labs, in the case of the tissue-specific and seed data sets. [The active set can be changed using the Data
Source menu]. It was programmed by Ben Vinegar and Debbie Winter, published in Winter et al., 2007, PLoS ONE 2(8):e718, and later by Justin Foong and Hardeep Nahal (Bassel et al., 2008, Plant Physiol. 147:143-155 and Wilkins et al., 2008, Plant Physiol. 149:981-993). Please cite any or all of these papers if you use images in talks or to guide your research. The tool is intended as a visualization aid. Be aware that in the case of the some of the AtGenExpress data sets where entire seedlings were sampled, expression may appear in the eFP representation to be in the entire seedling. This just reflects the fact that bulk tissues were sampled, and very likely does not reflect the actual tissue-specific expression patterns of the gene.
For a given gene, you can examine its expression in three different Modes. You can
• view its Absolute expression level in the tissues displayed,
• view its expression level Relative to its control value, which is useful for
seeing where the gene is most prominently expressed, or
• Compare its relative expression level to that of another gene (the Secondary AGI), which is useful for identifying tissues where the reference gene (Secondary AGI) is
potentially non-redundant relative to the other. You could also use some
"constitutively expressed" gene, such as alpha-tubulin, as the reference gene.
In the case of the Developmental and Seed series, for any given gene we calculate the median for all of the samples displayed on the particular eFP browser view and use that as the control value for calculating the relative level. The control values for the other series is either the zero time point, or the appropriate non-treated time point sample.
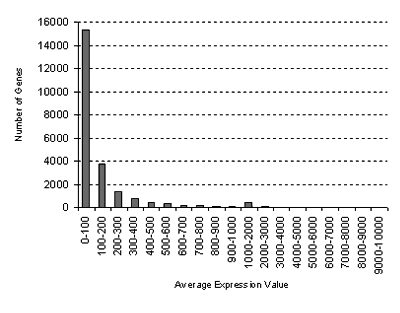
In all cases, the default Signal Threshold for the colour-scale is the
maximum for the Mode in question. That is, if the maximum absolute expression
level is, say, 1867 for your gene of interest, that will be indicated by red in
the default setting. If not, you will be alerted to the fact that the threshold changes as you change views. However, if you wish to compare different genes, it is
useful to use a specified Signal Threshold, of say 1000, for all genes you are
examining. In this case anything coloured red in the image is expressed at 1000
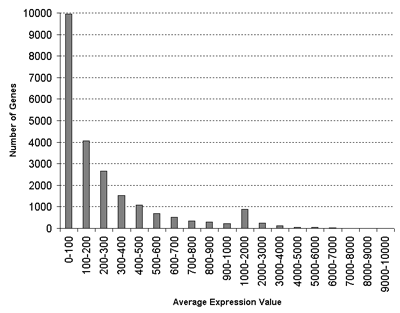
or higher. You will also be alerted if the standard deviations in some samples are high, or if the values are low, which might affect the ratio calculations. Note that the distribution of average gene expression values
looks like this:
for the Schmid et al.
(2005) Arabidopsis Atlas of Development:
RMA normalization
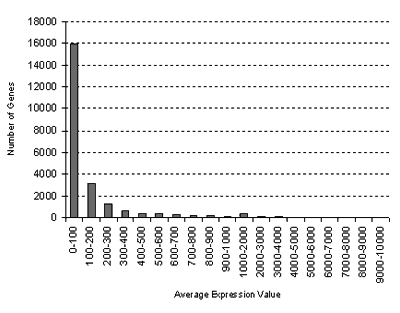
for the Schmid et al.
(2005) Arabidopsis Atlas of Development plus seed germination and tissue-specific samples:
GCOS normalization: TGT 100

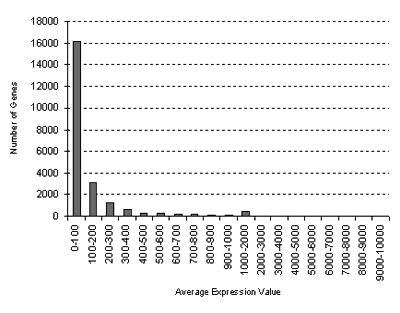
for the Abiotic Stress Series from Kilian et al. (2007):
GCOS normalization: TGT 100
for the Biotic Stress Series:
GCOS normalization: TGT 100
for the Hormone Series:
GCOS normalization: TGT 100
for the Chemical Series:
GCOS normalization: TGT 100
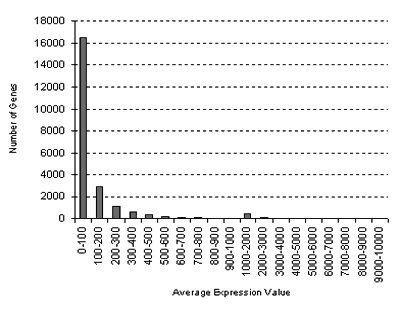
for the Seed Series:
GCOS normalization: TGT 100
so you can tell if your given gene is a high expresser or not
based on the maximum value in the non-signal threshold mode. Clicking on the
given tissue area in the image will take you to the NASCArrays entry for the
data sets. Further information on the samples may be found on the website
from Detlef Weigel's group. You can design direct links to the eFP Browser
by creating links that look like http://www.bar.utoronto.ca/efp/cgi-bin/efpWeb.cgi?modeInput=Absolute&primaryGene=At1g04310
(Developmental_Map is the default Data Source, to choose another series add, for example, '&dataSource=Abiotic_Stress' ). Further information on creating links may be found on the eFP Browser Development site. eFP representations can only be generated for AGI numbers that are in the
Affymetrix ATH1 GeneChip lookup table indicated on the BAR homepage.
The Arabidopsis Cell eFP Browser and the Mouse eFP Browser are variations on the above. In the case of the Cell eFP Browser we use predicted and documented subcellular localizations of Arabidopsis proteins from the SUBA database (Heazlewood et al. 2007, Nucleic Acids Reseach 35:D213-8). In the case of the Mouse eFP Browser we have used the arcsinh median-subtracted and zeroed data from Zhang et al. (2004, J. Biology 3:21).
Cross-Species Expression Browsing
Cross-species browsing of gene expression information has been made possible between Arabidopsis and Poplar.
To browse expression information for Poplar orthologs of an Arabidopsis AGI, enter an AGI of interest into the 'Primary AGI ID' box in the Arabidopsis eFP Browser and hit the 'Go' button. If any Poplar orthologs exist, they will be listed and ranked by Spearman Correlation
Coefficient (SCC) value. Links will be provided to Poplar eFP Browser views for each ortholog. Similarly, to view expression information for any Arabidopsis orthologs of a given Poplar probe set, enter a probe set of interest into the 'Poplar Probeset' box in the Poplar eFP Browser and hit the 'Go' button.
If any Arabidopsis orthologs exist, they will be listed and ranked by Spearman Correlation Coefficient (SCC) value. Links will be provided to Arabidopsis eFP Browser views for each ortholog. This enables the user In the future, this functionality will also be applied
to the Medicago eFP Browser, Rice eFP Browser, and Barley eFP Browser.
In order to rank the orthologs within each orthologous cluster, the tissues to be compared for such an analysis first needed to be deduced. This was done by computing SCC values between Arabidopsis tissues and all Poplar tissues, utilizing
data from genes exhibiting one-to-one orthology. In this way, the most homologous tissues between the two species were found. A heatmap showing these results is presented below. Homologous tissues (as predicted by ranking analysis) are highlighted
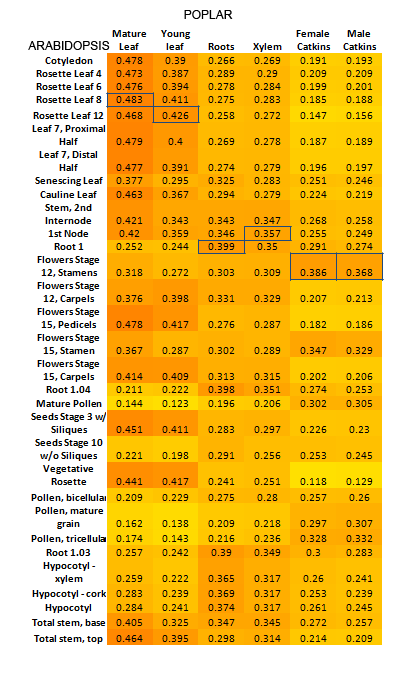
Once these tissue equivalencies had been calculated, expression data for each gene in each orthologous cluster was retrieved based on these homologous tissues. For each cluster, rankings were then computed between all Arabidopsis genes and all Poplar genes
using the data that had been retrieved. In this way, orthologs were ranked using their expression profiles.
Mouse electronic Fluorescent Pictograph Browser
The Mouse eFP Browser tool
paints gene expression information for your desired gene (of about 29,000 genes) onto a diagrammatic representation of 55 tissues sampled in Zhang W, et al. The functional landscape of mouse gene expression. J Biol. 2004, 3:21.
Expression values have been normalized, arcsinh-transformed, median-subtracted and negative values (below median) have been zeroed.
For more information please see the Mouse Gene Prediction Database at mgpd.med.utoronto.ca. Use the MGPD to identify the correct XM_ identifier for your gene of interest.
Arabidopsis Interactions Viewer
The Arabidopsis Interactions Viewer allows you to view predicted and experimentally-determined protein-protein interactions (PPIs) in Arabidopsis.
• Predicted interactions or interologs: Interologs are identified based on orthology to proteins which have been documented to interact in other species. In the case of our database, Drs Matt Geisler and Jane Geisler-Lee at Southern Illinois University used protein-protein interaction data sets from 7 species - 2 yeasts, worm, Drosophila, E.coli, mouse and human - and searched for orthologs of interacting proteins in Arabidopsis - this is called the Interactome 2.0. The CV (confidence value) of an interlog is based on the number of times an interaction was identified in a given species and also in how many species the interaction was detected. A higher CV is better. A paper describing the methodology for the Interactome 1.0 derived from 4 organisms was published in 2007 (Geisler-Lee et al., 2007).
• Experimentally-determined interactions: These were retrieved from the Biomolecular Interaction Network Database (BIND) and other publications cross-referenced by PubMed ID or DOI in the output of the Interactions Viewer. Note "experimental determination" can include high-throughput methods such as yeast two hybrid screens. Links in the output of the Arabidopsis Interaction Viewer will take you to these literature sources or parent databases.


Arabidopsis interactions, both predicted and experimentally-determined, are also indicated by coloured loops on the output of Expression Browser, Expression Angler and any other tool that uses Data MetaFormatter to display expression data.
The output page of the AIV contains a links to Cytoscape, .sif, and spreadsheet versions of the data in the AIV output. You can also overlay the nodes with expression information from our extensive databases of Arabidopsis gene expression as viewable through the eFP Browser. Click the 'Show Expression Options' box on the output to choose the data set you'd like to use to retrieve expression information for. This may help defined PPI subnetworks acting in certain tissues.
It is also possible to access the AIV's data via PSICQUIC. PSICQUIC uses MIQL (Molecular Interactions Query Language) which is based on Lucene's syntax and REST. So you can use single words or phrases in conjunction with operands/column names/groupings to search for interactions. You could search for ASK1, or for certain AGI IDs, or particular detection methods etc. In the case of ASK1, it maps to two AGI IDs, At1g10940 and At1g75950. As a result, the query:
http://bar.utoronto.ca:9090/psicquic/webservices/current/search/query/ASK1
retrieves protein-protein interactions for both At1g10940 and At1g75950. If we just want protein-protein interactions involving At1g10940, we can construct the MIQL query to search for ASK1 but exclude interactions involving At1g75950 (ASK1 NOT At1g75950):
http://bar.utoronto.ca:9090/psicquic/webservices/current/search/query/ASK1 NOT At1g75950 (you'll need to use %20 to replace the spaces in this syntax, as per the hyperlinked example).
This link provides a few good examples of other ways to construct queries using Lucene's syntax:
https://code.google.com/p/psicquic/wiki/MiqlReference
Our webservice is based on PSIMITAB 2.5, so you can use any of the fields listed in the table above to narrow your search criteria to specific columns as well.
Also, in addition to the "query" search method, you can use two other methods to search for interactions ("interactor" and "interaction").
This link goes into more detail about constructing the URL and using the other two methods, as well as using additional parameters to return a specific number of results, or returning the data in a specific format (ie. XML, tab-delimited), or just returning the total number of interactions (ie.
http://bar.utoronto.ca:9090/psicquic/webservices/current/search/interactor/ASK1%20NOT%20At1g75950?format=count):
http://code.google.com/p/psicquic/wiki/PsicquicSpec_1_3_Rest
Cytoscape 3 also enjoys native PSICQUIC connectivity, so you can automatically import interactions from the BAR's AIV DB containing almost 100,000 experimentally-determined and predicted protein-protein interactions easily and automatically!
Updated 17 Dec 2017 by NJP.